
Starting a small business is an exciting venture, filled with dreams of success and the desire for autonomy. However, the stark reality is that not all businesses survive the test of time. According to the U.S. Bureau of Labor Statistics (BLS), about 24.2% of U.S. businesses fail within their first year of operation. Understanding the factors contributing to these survival rates can help aspiring entrepreneurs prepare better and increase their chances of longevity in a competitive landscape.
Lendio looked at state and industry data to determine what factors can contribute to a business's success or failure.
Key findings
- The longer a business is in operation, the higher the failure rate. BLS data shows that approximately 24.2% of small businesses do not survive their first year. However, that number grows the longer businesses are in operation. After five years, 48% have failed, and 65.3% have failed at the 10-year mark.
- Business failure rates are higher for specific industries. Nearly 25% of businesses in the transportation and warehousing industry fail within the first year. The mining, quarrying, oil and gas extraction and information industries follow closely behind with 24% of their businesses failing in the first year. This trend may be attributed to various challenges, including fluctuating demand, rising operational costs, and intense competition within these sectors. Companies must navigate logistical complexities and maintain efficiency to survive, making it crucial for entrepreneurs in these industries to develop robust strategic plans.
- The West Coast sees both the highest and lowest business failure rates within the first year. Washington state has the highest failure rate, with 40.8% of its businesses failing in the first year. Conversely, California has the lowest failure rate within the first year, with 18.5% of its businesses failing within the first year.
The statistics at a glance.
The statistics around small business survival can be sobering. Approximately 24.2% of private sector businesses in the U.S. fail within their first year of operation. Unfortunately, the trend does not improve much over time; after five years, nearly half—48.5%—have faltered, and after a decade, about 65.1% of businesses have closed their doors for good. These figures highlight the fiercely competitive environment small businesses face and the various challenges that can impact their viability.
| State | Business failure rate within 1 year | Rank, 1-year failure rate | Business failure rate after 5 years | Rank, 5-year failure rate | Business failure rate after 10 years | Rank, 10-year failure rate |
|---|---|---|---|---|---|---|
| Alabama | 23.5% | 26 | 45.6% | 42 | 63.9% | 35 |
| Alaska | 27.3% | 6 | 42.7% | 49 | 60.7% | 48 |
| Arizona | 25.7% | 10 | 50.4% | 15 | 65.9% | 22 |
| Arkansas | 21.9% | 42 | 50.8% | 13 | 66.2% | 21 |
| California | 18.5% | 51 | 46.2% | 39 | 64.5% | 32 |
| Colorado | 23.8% | 22 | 50.1% | 17 | 66.5% | 16 |
| Connecticut | 25.2% | 16 | 48.9% | 26 | 67.0% | 11 |
| Delaware | 25.0% | 18 | 51.9% | 8 | 68.8% | 5 |
| District of Columbia | 32.2% | 2 | 58.1% | 1 | 70.8% | 2 |
| Florida | 22.6% | 37 | 49.2% | 23 | 65.5% | 23 |
| Georgia | 28.7% | 4 | 51.0% | 10 | 65.3% | 26 |
| Hawaii | 23.0% | 33 | 49.6% | 20 | 65.2% | 28 |
| Idaho | 30.7% | 3 | 52.2% | 6 | 66.5% | 16 |
| Illinois | 23.0% | 33 | 44.9% | 44 | 63.7% | 37 |
| Indiana | 23.0% | 33 | 46.9% | 36 | 61.4% | 44 |
| Iowa | 23.5% | 26 | 46.2% | 39 | 61.1% | 45 |
| Kansas | 26.2% | 7 | 53.5% | 4 | 67.1% | 10 |
| Kentucky | 18.8% | 50 | 47.8% | 30 | 62.7% | 39 |
| Louisiana | 23.6% | 25 | 47.2% | 33 | 65.0% | 30 |
| Maine | 24.0% | 20 | 46.8% | 38 | 62.5% | 41 |
| Maryland | 25.1% | 17 | 51.0% | 10 | 66.5% | 16 |
| Massachussetts | 19.2% | 49 | 43.3% | 47 | 61.1% | 45 |
| Michigan | 21.9% | 42 | 45.0% | 43 | 64.8% | 31 |
| Minnesota | 22.3% | 38 | 42.4% | 50 | 59.2% | 50 |
| Mississippi | 23.5% | 26 | 47.9% | 29 | 65.4% | 24 |
| Missouri | 25.4% | 13 | 55.4% | 2 | 69.3% | 4 |
| Montana | 26.1% | 8 | 42.4% | 50 | 60.1% | 49 |
| Nebraska | 23.2% | 21 | 49.1% | 24 | 69.7% | 3 |
| Nevada | 28.2% | 5 | 52.9% | 5 | 66.8% | 13 |
| New Hampshire | 25.3% | 15 | 54.0% | 3 | 66.3% | 20 |
| New Jersey | 21.4% | 45 | 50.5% | 14 | 66.8% | 13 |
| New Mexico | 25.7% | 10 | 51.9% | 8 | 68.3% | 6 |
| New York | 21.5% | 44 | 50.1% | 17 | 66.8% | 13 |
| North Carolina | 23.3% | 30 | 47.0% | 34 | 62.6% | 40 |
| North Dakota | 22.9% | 36 | 49.0% | 25 | 67.7% | 9 |
| Ohio | 23.8% | 22 | 47.0% | 34 | 61.0% | 47 |
| Oklahoma | 20.9% | 48 | 48.8% | 27 | 66.5% | 16 |
| Oregon | 25.6% | 12 | 47.8% | 30 | 61.6% | 43 |
| Pennsylvania | 21.3% | 47 | 45.8% | 41 | 65.2% | 28 |
| Rhode Island | 25.4% | 13 | 50.2% | 16 | 66.9% | 12 |
| South Carolina | 22.0% | 41 | 49.4% | 22 | 65.4% | 24 |
| South Dakota | 26.0% | 9 | 43.9% | 45 | 58.2% | 51 |
| Tennessee | 23.1% | 32 | 46.9% | 36 | 65.3% | 26 |
| Texas | 22.2% | 39 | 47.3% | 32 | 64.1% | 34 |
| Utah | 23.7% | 24 | 49.5% | 21 | 62.3% | 42 |
| Vermont | 24.6% | 19 | 49.7% | 19 | 64.2% | 33 |
| Virginia | 22.2% | 39 | 43.5% | 46 | 68.3% | 6 |
| Washington | 40.8% | 1 | 51.0% | 10 | 76.0% | 1 |
| West Virginia | 23.4% | 29 | 42.9% | 48 | 63.9% | 35 |
| Wisconsin | 21.4% | 45 | 48.1% | 28 | 63.2% | 38 |
| Wyoming | 23.9% | 21 | 52.0% | 7 | 68.0% | 8 |
| Average | 23.2% | 48.5% | 65.1% |
Geographic variations in failure rates.
Interestingly, there are notable geographical differences in business survival rates across the United States. Washington State has the highest business failure rate within the first year, with a staggering 40.8% of businesses not making it past this critical milestone. Following closely behind are the District of Columbia at 32.2% and Idaho at 30.7%.
On the contrary, California boasts the lowest business failure rate within the first year, with only 18.5% of businesses failing. Kentucky is just behind at 18.8%, and Massachusetts follows at 19.2%.

However, entrepreneurs should not let this data discourage them. A closer look at the data reveals that a significant number of locations exhibit below-average failure rates, indicating pockets of resilience among small businesses. Specifically, 32 out of the 51 locations examined for this piece boast lower-than-average one-year failure rates, suggesting that many entrepreneurs in these areas benefit from supportive ecosystems.
23 locations maintain below-average five-year failure rates, showcasing their ability to weather initial challenges and sustain growth over time.

Impressively, 24 of the locations also enjoy below-average ten-year failure rates, highlighting long-term viability and the significance of local conditions in nurturing successful business ventures.

The environment in which a business operates can significantly influence its chances of survival. In fact, according to a study by Lendio, environmental factors such as access to funding, tax incentives, and a flourishing local economy can significantly enhance business's chances of survival and success in different states. By selecting a location that aligns with their business goals and provides the necessary resources, aspiring entrepreneurs can create a stronger foundation for long-term viability and growth.
Industry-specific challenges.
Beyond geographical factors, the industry in which a business operates also plays a crucial role in its survival.
Industries with lower survival rates
The transportation and warehousing industry is particularly challenging, with a failure rate of 24.8% within the first year. This figure is closely followed by the mining, quarrying, and oil and gas extraction industry at 24.4% and the information industry at 24.1%. These industries often face unique obstacles, from fluctuating demand to regulatory pressures, making it essential for entrepreneurs to understand the intricacies of their chosen field.
Industries with higher survival rates
Conversely, certain industries demonstrate significantly higher survival rates within their first year of operation. For instance, businesses in the retail trade sector have a low failure rate of just 12.9% in their first year. Similarly, the accommodation and food services industry shows a solid survival rate, with just 14.2% of businesses failing within their first year. The agriculture, forestry, fishing, and hunting industry also presents encouraging statistics with a failure rate of just 15.1%. These figures suggest that businesses in these industries may benefit from more stable demand or fewer operational hurdles, contributing to their advanced longevity.
When selecting an industry for a new business venture, it’s essential to consider not only the initial survival rates but also the long-term viability of that sector. While industries like retail and accommodation may show promising survival rates in their first year, it’s important to assess trends over a longer timeframe. For instance, the food industry, despite often having a solid start, can face challenges related to saturation, changing consumer preferences, and increasing competition, which might impact longevity. A comprehensive assessment of both short-term and long-term survival statistics will help entrepreneurs make informed decisions, ensuring they choose a path that not only offers immediate success but also sustainable growth in the years to come.
Recent trends and influencing factors.
It's worth noting that the 1-year business failure rate has jumped by at least two percentage points for two consecutive years. This increase can be attributed to several factors, including various economic pressures. Businesses should be adaptable and resilient to help stay afloat during difficult times.
The business failure rates for the past three years are as follows:
- March 2020 - March 2021: 18.4% failure rate
- March 2021 - March 2022: 20.8% failure rate
- March 2022 - March 2023: 24.2% failure rate
Economic pressures can significantly influence a small business's chance of survival, affecting everything from cash flow to consumer spending. During periods of inflation, for instance, the rising costs of materials and services can squeeze profit margins, ultimately making it harder for a business to stay afloat. When expenses increase, many small businesses are forced to make tough decisions, whether that means raising prices, cutting costs, or even reducing staff. These changes can directly impact customer satisfaction and loyalty, leading to a decline in sales.
Additionally, economic downturns can lead to reduced consumer confidence. When individuals are uncertain about their financial future, they are less likely to spend, which means businesses may experience a dip in sales. This is particularly challenging for startups or small businesses that rely heavily on consistent sales to sustain operations.
Additionally, access to financing becomes more difficult during economic struggles, as lenders tighten their criteria for loans. As a result, small businesses may find themselves grappling with insufficient working capital, making it a challenge to cover day-to-day operational costs or invest in growth opportunities. Understanding these economic dynamics is crucial for entrepreneurs aiming to enhance their resilience and sustainability in an unpredictable market.
How businesses can build a strong foundation for success.
Given these statistics, aspiring entrepreneurs must recognize the importance of building a strong foundation for their businesses. Here are some strategies that can help increase survival rates:
- Market research. Understanding the market landscape, customer needs, and industry trends is crucial for business planning. Thorough market research can help entrepreneurs mitigate risks by ensuring they address the real demands that businesses within their respective industries face.
- Financial planning. Sound financial practices are essential. Businesses should maintain a clear budget, monitor cash flow, and prepare for unforeseen expenses to avoid financial pitfalls.
- Flexible business models. Being adaptable and willing to pivot in response to market changes can make a significant difference in a business's longevity. This might involve diversifying service offerings or exploring new customer segments.
- Networking and support. Joining local business networks and seeking mentorship can provide invaluable resources and support. Learning from others' experiences can offer insights into avoiding common pitfalls.
- Staying informed. Keeping on top of economic trends, consumer preferences, and industry developments can help businesses remain competitive. This proactive approach can foster innovation and allow businesses to adapt to changes more effectively.
Conclusion
While the statistics on small business survival rates may appear daunting, they also serve as a call to action for entrepreneurs. By understanding the factors that contribute to business failure and implementing strategic practices to counter them, aspiring business owners can improve their chances of success. The road may be rocky, but with careful planning, resilience, and adaptability, the dream of owning a thriving business can indeed become a reality.

Small businesses play a vital role in the economy, accounting for a significant portion of job creation and economic growth. However, starting and running a small business can be challenging, with numerous factors impacting success. By understanding the latest trends and insights on small business statistics, entrepreneurs and business owners can gain valuable insights into the current state of the small business landscape and develop effective strategies to thrive.
In this blog post, we will explore key statistics on small businesses, including sentiment, funding sources, and common challenges.
Growth and revenue
Small business growth and revenue statistics.
- There are 33.3 million small businesses in the United States.
- 5.5 million new business applications were filed in 2023 continuing a surge in small business growth since the pandemic. (U.S. Census Bureau)
- Small businesses make up 99% of all U.S. companies.
- Small businesses employ 61.6 million people and nearly 46% of all private-sector workers.
- Small businesses saw a gross revenue of $13.3 trillion annually.
- The number of businesses owned by Black, Hispanic, and Asian Americans has increased by more than 50% from 2007 to 2020.
- The most common industries to start a business include retail, professional services, and construction.
Small business owners
Who owns small businesses?
- 63% of employer firms are owned by men.
- In total, women own 13.8 million businesses employing 10 million workers and generating $3.9 trillion in revenue across the U.S.
- There are an estimated 3.7 million Black-owned businesses in the United States and an estimated 161,422 Black-owned businesses with at least one employee in the United States.
- Veterans own 8.1% of businesses. (SBA)
Small business sentiment
Small business owners’ sentiment statistics.
- 49% of small business owners believe it’s somewhat or much harder to achieve the dream of owning a small business than in the past. 33% of SMB owners believe it is somewhat or much easier. 19% say it’s about the same.
- 89% of small business owners believe it’s possible to attain the goal of owning your own business.
- The Mid-Atlantic region (New York, New Jersey, and Pennsylvania) had the most positive sentiment toward being able to start a business, with 96% of respondents believing it’s possible.
- The East South Central region (Kentucky, Tennessee, Alabama, and Mississippi) had the most negative sentiment, with 30% of respondents stating they didn’t believe it was possible to obtain the goal of owning their own business.
Source: Lendio
Small business challenges
Small business owners’ challenges statistics.
- 41% of small business owners state their number one challenge is related to the economy and inflation, with another 14% struggling most with financial concerns.
- Hiring remains the No. 1 challenge for 11% of small business owners, while COVID recovery vexes 4.5% of business owners and supply chain issues 3.4% of SMB owners.
- 56% of small businesses state that large corporations have a negative impact on growth opportunities for their businesses.
- 66% of small business owners state having a financial safety net would have had the most impact on their ability to start a business, followed by access to capital at 53%.
- 24.2% of new businesses fail within the first year. (BLS)
- Of the respondents, 52% state that living in an area with lower business costs and a lower cost of living would be helpful. 44% state lower taxes would have a positive impact.
- 33% state more customers and resources, 26% state less cultural bias, and 32% state access to educational resources and guidance would have had an impact on their ability to start a business.
Source: Lendio
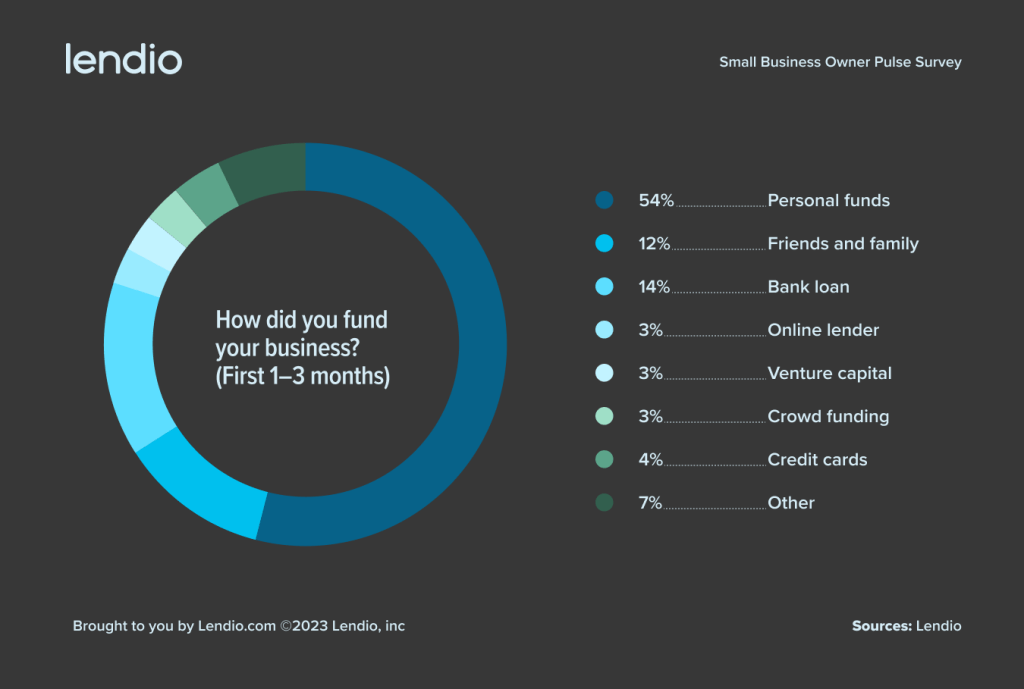
Small business funding
Small business funding statistics.
- 54% of SMB owners started their business with personal funds, with another 12% relying on friends and family. 14% used a bank loan, 3% an online lender, 3% venture capital, 3% crowdfunding, and 4% credit cards.
- 79% of SMB owners needed less than $100,000 to start their business, while 43% needed less than $10,000.
- The average loan amount for a small business owner is $47,000.*
- A small business has a median of five employees when it is first funded by an outside lender.*
- A small business has been in business for about three years (a median of 40 months) when it is first funded by an outside lender.*
- Minorities received 32% of SBA 7(a) loans and 30% of SBA 504 loans in 2023.
*Based on internal Lendio data of 300,000+ loans funded since 2013.
Source: Lendio
Generational differences
Small business owner generational differences statistics.
- Those under the age of 45 report needing more money to start their business, with 23% needing $100K to $250K. In contrast, only 10% of those aged 45+ needed that amount.
- While both generations rely heavily on personal funds to start their businesses, those under the age of 45 have started to turn to alternative sources, such as crowdfunding (6%) and online lenders (5%).
- 46% of younger business owners (18-44) believe owning a small business is somewhat or much easier to achieve.
- 58% of older business owners (45+) believe owning a small business is somewhat or much harder to achieve.
- While a large majority (71%) of SMB owners aged 18-44 believe large corporations have a negative impact on growth opportunities for their business, 57% of those 45+ disagree, stating large corporations don’t have a negative impact on their business.
- While the generations agree that a financial safety net, access to capital, and low costs are most critical to success, those 44 and younger place greater importance on access to educational resources and see cultural bias as a larger inhibitor.
- Both generations agree that the freedom to live how you want is the most important component of the American dream. Perhaps unsurprisingly, those 45+ place greater importance on retirement (46%), while those under 45 place more importance on becoming wealthy (36%).
Source: Lendio

As a record number of businesses opened last year, Lendio reveals the top states to start a small business.
2023 was a record-breaking year for small businesses as a record-breaking 5.5 million new business applications were filed in 2023, according to the Small Business Administration.
The 2020s have been one of the most challenging historical decades for small business owners. The economic impact of the global pandemic continues to ripple through the American and global economies. Inflation, high interest rates, and the unprecedented migration of educated workers to new locations have been just a few of the challenges that small businesses face. Amid such paradigm shifts in how—and where—Americans work and live, Lendio commissioned this study to see the state of the small business landscape across the country.
Key Findings
We explored trends in ten metrics that are critical to the success of small business owners in 2024’s rapidly changing and uncertain landscape. These metrics included small business lending, cost of living, real estate data, educated worker migration, corporate tax rates, state-level incentives for business owners, and more. Our key findings include:
- Top states – Florida, Texas, and North Carolina rank top in our list due to lower taxes, an influx of movers to these states, sufficient business funding, and higher amounts of personal consumption expenditures.
- Bottom states – Hawaii, New Hampshire, and Nebraska are the bottom three states, due to low business funding and venture capital availability, limited local incentive programs, high tax rates, and high cost of living.
- Ranking shifts – While the states that made the top 10 stayed the same from Lendio’s 2023 analysis, there were some shifts in the line-up including Florida edging out Texas for the top spot.
- Ranking factors – The states that rank highest are those that experienced large influxes of migration, with reasonable costs of living. The availability of business funding, venture capital, and local incentive programs were also important factors that impacted the rankings.
Top 10 best states to start a small business.
10. Oklahoma (Previously 7)
This state boasts some of the most favorable local incentives in the country for business owners, with 84 inventive programs in total. Housing prices and cost of living are lower, compared to other states. Combined with a low, 4% corporate income tax rate, this creates an environment many entrepreneurs will find attractive. On the flip side, businesses in Oklahoma have lower-than-average access to capital and have seen a decline in educated workers moving to that state.
9. Utah (Previously 10)
Businesses in the state of Utah have exceptional access to capital. Utah is approved for the highest number of SBA loans per 100,000 population in the U.S. It also had $10,000 in VC funding per $1 million GDP, ranking No.10 in the U.S. in 2023. The state also has a lower corporate tax rate of 5% and offers 34 tax incentives to small businesses. The reason Utah did not rank higher on our list is that it has become an increasingly popular destination, and as a result, housing costs have increased significantly.
8. Massachusetts (Previously 4)
It’s no wonder tech-savvy Massachusetts gets the most amount of venture capital disbursed per $1 million of GDP, ranking No. 1 in the U.S. The state offers 73 different incentives for business owners. Massachusetts businesses also have one of the highest five-year survival rates of 57%. On the flip side, it has one of the highest median housing values in the U.S., and it is seeing more people leaving (57,000)—rather than moving to—the Bay State.
7. Georgia (Previously 9)
Georgia is also a great place for businesses, as it is within the top states with the most small business loans approved—over 30 small business loans per 100,000 residents through Lendio’s marketplace. Georgia has seen an influx of 81,406 people move in, making it the sixth-best state in this crucial category. Although the housing prices remain reasonable, Georgia has the second-highest growth in cost of living.
6. Ohio (Previously 3)
Ohio has no corporate income tax rate. Even with the state’s gross receipt tax rate, which is not strictly comparable to the corporate income tax rate, it’s still considered a low-tax state. Ohio is also among the top states that have small business loans approved per 100k residents. With very low housing costs and good local incentive programs for businesses, Ohio is a good place for small businesses to settle.
5. South Carolina (Previously 8)
Half of all startups in the Palmetto State have survived at least five years, and the state government offers 77 different incentives for small business owners—only three states offer more incentives than South Carolina. The state has a low 5% corporate income tax rate. In addition, housing prices and cost of living are among the lowest of all states, and 84,030 people moved in in 2022, making it the 4th-hottest place to relocate.
4. Colorado (Previously 6)
If you are in Colorado, you may have a good chance to land a small business loan. Colorado ranks No. 7 in the U.S. for issuance of small business loans, with 27 small business loans per 100,000 residents. It also has the 7th highest amount of venture capital per $1 million GDP. With 55,768 educated workers moving here and a 4% corporate income tax rate, business owners can find a good place to start a small business.
3. North Carolina (Previously 5)
North Carolina has been a hot place for in-migration, with 99,796 people relocating there in 2022 (the 3rd highest in the U.S.). Businesses here have an above-average, five-year survival rate. The state also has a low corporate tax rate of 2.5% and above-average access to business loans. With low housing costs, business owners find it an attractive location to start and run a small business.
2. Texas (Previously 1)
Texas ranks as the second-best state for small businesses. While Texans receive a lower amount of SBA loan approvals/100K residents than other states, they were the 7th highest state for loans offered through Lendio’s marketplace. Of all businesses started in 2017 in the state, more than half survived five years of operations, outlasting those in many other states. According to Census Bureau data, over 400,000 people with at least some college education moved into Texas in 2022, making it a prime location for educated entrepreneurs to spread their wings. Beyond just workers, Texas has become one of the most popular places for Americans to relocate—thanks, in part, to its lack of a state income tax.
1. Florida (Previously 2)
Florida is the best state to start a business due to a low corporate tax rate (5.5%) and the mass migration of consumers and companies to the state. The Sunshine State sees more than half of its startup businesses survive for at least five years. It’s also a top recipient of SBA loan dollars (12th compared to other states) and ranked 2nd for the number of loan offers facilitated through Lendio’s marketplace.
| State | Rank | 5-year survival rates | SBA per 100K | Lendio marketplace loans per 100K | VC Per $1M GDP | Incentive programs | Corporate income tax rates | Educated worker mobility | Population growth | Median housing costs | Personal consumption expenditures |
|---|---|---|---|---|---|---|---|---|---|---|---|
| Florida | 1 | 50.80% | 23.17 | 37.1 | $6,087 | 41 | 5.5% | 2,130.62 | 318,855.00 | $354,100 | $1,041,880 |
| Texas | 2 | 52.70% | 14.31 | 24.0 | $4,662 | 39 | 1,312.58 | 230,961.00 | $275,400 | $1,302,566 | |
| North Carolina | 3 | 53% | 12.70 | 19.4 | $6,891 | 32 | 2.5% | 1,700.80 | 99,796.00 | $280,600 | $468,160 |
| Colorado | 4 | 49.90% | 26.93 | 25.0 | $12,747 | 38 | 4% | 2,365.96 | 5,376.00 | $531,100 | $292,092 |
| South Carolina | 5 | 50.60% | 13.19 | 20.2 | $2,234 | 77 | 5.0% | 2,099.73 | 84,030.00 | $254,600 | $224,912 |
| Ohio | 6 | 53% | 31.91 | 12.5 | $4,320 | 54 | 888.06 | -9,165.00 | $204,100 | $529,179 | |
| Georgia | 7 | 49% | 17.00 | 31.0 | $2,973 | 49 | 6% | 1,592.28 | 81,406.00 | $297,400 | $465,205 |
| Massachusetts | 8 | 56.70% | 23.34 | 11.8 | $32,800 | 73 | 8.0% | 1,575.66 | -57,292.00 | $534,700 | $353,182 |
| Utah | 9 | 50.50% | 33.06 | 23.4 | $10,705 | 34 | 5% | 1,356.89 | 12,898.00 | $499,500 | $148,611 |
| Oklahoma | 10 | 51.20% | 12.24 | 12.0 | $1,242 | 84 | 4.0% | 1,255.80 | 26,791.00 | $191,700 | $164,074 |
| Virginia | 11 | 56.50% | 12.31 | 15.0 | $5,089 | 63 | 6.0% | 1,836.04 | -23,952.00 | $365,700 | $381,395 |
| Michigan | 12 | 55% | 26.18 | 13.5 | $2,122 | 42 | 6.0% | 828.14 | -8,482.00 | $224,400 | $457,968 |
| Connecticut | 13 | 51.10% | 23.06 | 14.0 | $10,277 | 65 | 7.5% | 2,015.19 | -13,547.00 | $347,200 | $177,408 |
| Pennsylvania | 14 | 54.20% | 16.68 | 13.9 | $5,471 | 81 | 8% | 1,024.34 | -39,957.00 | $245,500 | $623,920 |
| New York | 15 | 49.90% | 21.94 | 17.3 | $15,344 | 69 | 7% | 996.22 | -299,557.00 | $400,400 | $923,029 |
| North Dakota | 16 | 51% | 17.60 | 10.1 | $1,107 | 65 | 3% | 1,470.04 | -2,710.00 | $243,100 | $39,866 |
| Wyoming | 17 | 48% | 14.04 | 39.7 | $16,150 | 21 | 2,022.58 | 2,152.00 | $292,300 | $28,567 | |
| Arizona | 18 | 49.60% | 17.22 | 22.8 | $3,230 | 23 | 4.9% | 2,149.83 | 70,984.00 | $402,800 | $318,201 |
| Alaska | 19 | 57.30% | 18.41 | 10.9 | $1,813 | 31 | 5.3% | 2,303.09 | -6,126.00 | $336,900 | $36,682 |
| Maine | 20 | 53.20% | 28.87 | 10.4 | $1,304 | 44 | 7% | 1,697.54 | 11,600.00 | $290,600 | $66,048 |
| California | 21 | 53.80% | 18.71 | 26.7 | $28,232 | 47 | 9% | 976.00 | -343,230.00 | $715,900 | $1,802,396 |
| Minnesota | 22 | 57.60% | 31.02 | 8.6 | $5,069 | 47 | 9.8% | 1,100.50 | -19,400.00 | $314,600 | $266,445 |
| Vermont | 23 | 50.30% | 25.33 | 7.3 | $13,481 | 44 | 7.2% | 1,971.23 | 1,141.00 | $304,700 | $30,746 |
| Arkansas | 24 | 49.20% | 10.50 | 10.4 | $1,861 | 60 | 2.7% | 1,260.02 | 18,209.00 | $179,800 | $128,037 |
| Montana | 25 | 54.30% | 16.60 | 13.2 | $4,504 | 49 | 7% | 2,159.93 | 16,003.00 | $366,400 | $55,649 |
| Delaware | 26 | 48.10% | 19.58 | 20.3 | $27,235 | 29 | 8.7% | 2,339.11 | 11,826.00 | $337,200 | $48,856 |
| Nevada | 27 | 47.10% | 20.94 | 36.3 | $5,492 | 24 | 2,184.69 | 20,781.00 | $434,700 | $144,682 | |
| Washington | 28 | 49% | 19.37 | 17.3 | $11,651 | 45 | 2,079.71 | -3,580.00 | $569,500 | $345,506 | |
| Kansas | 29 | 46.50% | 15.34 | 10.7 | $3,619 | 71 | 5.0% | 1,494.93 | -7,409.00 | $206,600 | $129,618 |
| Indiana | 30 | 53.10% | 18.77 | 9.8 | $2,091 | 30 | 4.9% | 933.87 | 5,230.00 | $208,700 | $298,717 |
| Illinois | 31 | 55.10% | 17.95 | 17.7 | $10,768 | 41 | 9.5% | 1,095.35 | -141,656.00 | $251,600 | $581,884 |
| Tennessee | 32 | 53.10% | 9.51 | 17.4 | $2,604 | 28 | 6.5% | 1,607.83 | 81,646.00 | $284,800 | $306,354 |
| Mississippi | 33 | 52.10% | 11.43 | 15.3 | $616 | 43 | 4.5% | 952.62 | -5,716.00 | $162,500 | $115,115 |
| Maryland | 34 | 49% | 15.57 | 15.8 | $5,731 | 98 | 8% | 1,518.50 | -45,101.00 | $398,100 | $266,490 |
| West Virginia | 35 | 57.10% | 9.10 | 8.1 | $424 | 55 | 6.5% | 956.91 | 474.00 | $155,100 | $76,209 |
| New Mexico | 36 | 48.10% | 11.21 | 15.3 | $2,294 | 53 | 5.4% | 1,743.17 | -4,504.00 | $243,100 | $86,746 |
| Idaho | 37 | 47.80% | 27.28 | 13.2 | $3,694 | 29 | 5.8% | 1,906.12 | 28,639.00 | $432,500 | $79,171 |
| Missouri | 39 | 44.60% | 15.95 | 13.6 | $2,162 | 46 | 4.0% | 1,202.00 | 5,024.00 | $221,200 | $284,035 |
| Rhode Island | 38 | 49.80% | 22.35 | 10.7 | $3,221 | 51 | 7.0% | 2,034.10 | -5,196.00 | $383,900 | $47,550 |
| Iowa | 40 | 53.80% | 10.60 | 8.5 | $1,106 | 61 | 6.3% | 969.28 | -7,292.00 | $194,600 | $141,784 |
| South Dakota | 41 | 56.10% | 21.43 | 8.3 | $88 | 22 | 1,384.72 | 8,424.00 | $245,000 | $43,659 | |
| Louisiana | 42 | 52.80% | 9.71 | 19.9 | $1,111 | 41 | 5.5% | 828.27 | -46,672.00 | $209,200 | $197,317 |
| Alabama | 43 | 54% | 9.08 | 16.1 | $1,031 | 30 | 6.5% | 1,207.25 | 28,609.00 | $200,900 | $211,183 |
| New Jersey | 44 | 49.50% | 25.14 | 18.1 | $2,787 | 42 | 7.7% | 1,402.75 | -64,231.00 | $428,900 | $440,925 |
| Kentucky | 45 | 52.20% | 10.21 | 7.8 | $525 | 46 | 5.0% | 1,125.15 | 10,420.00 | $196,300 | $192,315 |
| Wisconsin | 46 | 51.90% | 19.40 | 7.5 | $2,950 | 52 | 7.9% | 1,003.75 | 7,657.00 | $252,800 | $271,111 |
| Oregon | 47 | 52.20% | 19.25 | 13.3 | $3,599 | 48 | 7.1% | 1,665.08 | -17,331.00 | $475,600 | $178,845 |
| Nebraska | 48 | 50.90% | 16.48 | 11.0 | $3,042 | 37 | 6% | 1,217.16 | -4,270.00 | $232,400 | $93,515 |
| New Hampshire | 49 | 46% | 32.81 | 12.1 | $5,769 | 19 | 7.5% | 2,106.27 | 6,303.00 | $384,700 | $67,943 |
| Hawaii | 50 | 50.40% | 11.22 | 15.1 | $654 | 21 | 5.4% | 2,228.98 | -15,212.00 | $820,100 | $61,198 |
Final Thoughts
The state where your business operates has a direct impact on your ability to effectively run your company. As an entrepreneur, you get to decide which of these factors matters most to you.
Florida consistently performed in the top tier for business owners, earning it a No. 1 spot for its top small business loan dollars, mass migrations of educated workers and consumers, and reasonable tax rates. Meanwhile, Nebraska, New Hampshire, and Hawaii ranked last, in part because of their high costs of living and housing, fewer incentive programs for businesses, and fewer workers with bachelor’s degrees than many other states.
Wherever you work, each state presents opportunities and challenges. Navigate those factors successfully and you can run a competitive, impactful business. Do the right research. Decide which criteria matter most. Make sure you’ve got the capital to build your dreams. Then take on calculated risk to start something great with products and services that benefit all of us.
Methodology
We used publicly available data from a variety of federal government and nonprofit sources to identify the best and worst states for small businesses in 2024. We used a Z-score distribution to scale each metric relative to the mean across all 50 states. Outliers were reduced to a score of 2 or -2. Overall, we examined ten factors including:
Sources:
- Venture capital disbursed per $1 million of GDP, 2022 (National Science Foundation).
- Five-year startup survival rate from 2018-2023 (Bureau of Labor Statistics)
- Small business loans, 2023 (7a and 504 loans). (Small Business Administration)
- Small business financing offers through Lendio’s marketplace Q3 2023-Q2 2024.
- Small business incentives, 2023 (Council for Community and Economic Research)
- Corporate income tax rates calculated as an average across tiers, 2024 (Tax Foundation)
- Educated Worker Mobility, 2022 (Census Bureau)
- Hottest relocation markets, 2022 (Census Bureau via National Association of Realtors)
- Personal consumption expenditures, 2021-2022 (Bureau of Economic Analysis)
- Median housing value of owner-occupied housing units, 2022 (Census Bureau)
Note: In addition to regular income taxes, many states impose other taxes on corporations, such as gross receipts taxes and franchise taxes. Some states also impose an alternative minimum tax and special rates on financial institutions. Nevada, Ohio, Texas, and Washington do not have a corporate income tax but do have a gross receipts tax with rates not strictly comparable to corporate income tax rates.

For decades now, it’s been a game of catch-up for women in business—and they’ve gained a lot of ground. From 2019 to 2023, the number of new women-owned businesses grew at nearly double the rate of businesses owned by men. But the struggle is far from over. The statistics on women-owned businesses below highlight just how far women have come and the disparities we’ve yet to overcome.
How many women-owned businesses are there in the U.S.?
- Women are now majority owners in at least 35 percent of U.S. employer firms.
- In total, women own 13.8 million businesses employing 10 million workers and generating $3.9 trillion in revenue across the U.S.
- Women own 28.6% of employer firms with a revenue of $1 million or more.
- Of the 2 million employer firms owned by women in the U.S., 24% are owned by minorities.
- 3.6% of women-owned employer firms are owned by Black or African American women.
- 13% of women-owned employer firms are owned by Asian women.
- .8% of women-owned employer firms are owned by Native American or Alaskan native women.
What industries do women start businesses in?
Women start and run businesses in every industry.
Which states have the highest percentage of women-owned businesses?
Western states have the highest percentage share of women-owned businesses.
| State | Percent share of employer businesses owned by women |
| Washington | 42% |
| Idaho | 41% |
| New Mexico | 40% |
| Arizona | 39% |
| Montana | 39% |
Which states have the highest number of women-owned businesses?
High-population states have the highest number of women-owned businesses.
| State | Number of female-owned employer firms |
| California | 295,633 |
| Florida | 183,040 |
| Texas | 165,028 |
| Massachusetts | 164,151 |
| New York | 131,775 |
Stats on the growth of women in small business.
The number of women-owned businesses has grown substantially over the past decade.
- The number of women-owned businesses in the U.S. increased 13.86% from 2014 to 2021.
- A 2019 report from the JPMorgan Chase Institute found that businesses owned by women and businesses owned by men had equal survivability rates based on an analysis of 138,000 companies founded within the decade prior.
Stats on disparities in male- and female-owned small businesses.
Despite the rapid growth, women still face challenges in obtaining funding and growing their businesses.
- Women-owned businesses received just 32.6% of the approvals and 28.4% of the dollars offered in SBA 7(a) and 504 loans in the 2023 fiscal year.
- Women are more likely to apply for a loan with an online lender. 30% of women business owners reported applying for a loan through an online lender vs. 20% of men-owned businesses.
- Women are less likely to receive the full amount of funds requested. 45% of women-owned businesses were fully approved for the loan requested vs. 55% of men-owned businesses in 2023.
- 25% of women are denied a business loan vs. 19% of men.
- In 2021, 4.63% of federal contract dollars when to women-owned small businesses.
- 38% of women-owned businesses are operating at a profit vs 47% of men-owned businesses.
- 33% of men-owned businesses have annual revenues of $1 million or more vs. 16% of women-owned businesses.
The American business landscape has made progress for women entrepreneurs. Before federal legislation was passed in 1988, women business owners needed a male co-signer to apply for a loan. While lenders need to understand that women-owned businesses are as safe an investment as male-owned businesses, female entrepreneurs should also take the steps to apply for capital, particularly when that capital can be used to help grow the business.

The number of small businesses has been increasing in the United States over the past several years. Last year, the White House announced that more than 10 million small businesses were created in 2021 and 2022. Along with its growth in the total number of businesses, the U.S. is also seeing growth in the number of women-owned businesses in the country.
The number of women-owned businesses in the U.S. increased 13.6% from 2019 to 2023, making up 39.1% of all of the country’s businesses, according to research from Wells Fargo. In total, women own 13.8 million businesses employing 10 million workers and generating $3.9 trillion in revenue across the U.S. While this growth may be encouraging for women small business owners to see, it’s helpful to see which states are more favorable to start and run a new small business in.
Lendio analyzed seven metrics to determine the best states for women small business owners, including factors such as share of employer businesses owned by women, percentage of female-owned businesses that earn a revenue of $1 million or more, percentage of patents filed by women, and women’s VC funding (deal count) per woman-owned businesses.
Key findings
- Washington is the no. 1 best state for women small business owners. The percentage of woman-owned businesses in Washington outpaces every other state at 42% and has the highest percentage of female-owned businesses that earn a revenue of $1 million or more (34%).
- Delaware has the highest women’s VC funding deal count rate per women-owned businesses in the country. 6% of women-owned businesses in Delaware receive VC funding. This is a much higher percentage than the rest of the states, averaging at 1.16% of women-owned businesses receiving VC funding. Many businesses around the United States are incorporated out of Delaware, which is a contributing factor to this high percentage.
- Top states are mainly concentrated in the west. Delaware and Maryland are the only non-western states that reached the top 10 states on this list. Top states typically had higher shares of employer businesses owned by women (ex: 39% in Montana and Oregon) and higher percentages of growth of women-owned businesses from 2012 to 2020 (ex: 22% in Utah).
| State | Rank | Share of employer businesses owned by women, 2021 | Employment rate among women, 2022 | Percent female-owned businesses with revenue $1M+ | Percent change woman owned businesses 2012-2020 | Percent patents filed by women | Women's VC funding per woman owned business | Gini index |
|---|---|---|---|---|---|---|---|---|
| Washington | 1 | 42% | 59% | 34% | 8% | 13% | 2% | 0.4742 |
| Colorado | 2 | 36% | 63% | 27% | 19% | 10% | 2% | 0.4566 |
| Delaware | 3 | 32% | 57% | 21% | 17% | 13% | 6% | 0.4407 |
| Oregon | 4 | 39% | 59% | 29% | 10% | 15% | 1% | 0.4679 |
| California | 5 | 38% | 55% | 32% | 5% | 13% | 4% | 0.4953 |
| Utah | 6 | 34% | 60% | 24% | 22% | 10% | 1% | 0.4264 |
| Maryland | 7 | 34% | 59% | 25% | 12% | 14% | 2% | 0.4589 |
| Arizona | 8 | 39% | 56% | 30% | 17% | 11% | 0.70% | 0.4665 |
| Hawaii | 9 | 38% | 56% | 29% | 9% | 13% | 0.80% | 0.4574 |
| Wyoming | 10 | 38% | 58% | 31% | 3% | 8% | 1% | 0.4437 |
| Virginia | 11 | 35% | 61% | 25% | 21% | 13% | 1% | 0.4755 |
| Texas | 12 | 36% | 57% | 29% | 24% | 11% | 1% | 0.4796 |
| Nevada | 13 | 36% | 56% | 28% | 27% | 10% | 1% | 0.4685 |
| Florida | 14 | 38% | 55% | 29% | 36% | 10% | 0.60% | 0.4902 |
| Minnesota | 15 | 34% | 64% | 26% | 12% | 1% | 0.456 | |
| North Carolina | 16 | 36% | 56% | 27% | 23% | 11% | 1% | 0.4768 |
| Montana | 17 | 39% | 61% | 27% | 5% | 8% | 1% | 0.4652 |
| Vermont | 18 | 32% | 61% | 22% | -0.26% | 13% | 2% | 0.4452 |
| South Dakota | 19 | 35% | 64% | 21% | 0.18% | 14% | 0.30% | 0.4487 |
| Nebraska | 20 | 36% | 66% | 23% | -1% | 10% | 1% | 0.461 |
| Wisconsin | 21 | 34% | 59% | 26% | -1% | 12% | 1% | 0.451 |
| Kansas | 22 | 36% | 61% | 26% | -2% | 12% | 0.50% | 0.4632 |
| New Jersey | 23 | 31% | 58% | 23% | 17% | 16% | 1% | 0.4815 |
| Georgia | 24 | 34% | 56% | 25% | 26% | 10% | 0.80% | 0.4736 |
| Missouri | 25 | 36% | 57% | 26% | 4% | 11% | 1% | 0.4687 |
| New Mexico | 26 | 40% | 51% | 30% | -6% | 14% | 1% | 0.4796 |
| Oklahoma | 27 | 36% | 56% | 29% | 5% | 11% | 0.30% | 0.4743 |
| Indiana | 28 | 33% | 58% | 25% | 3% | 11% | 1% | 0.4561 |
| Massachusetts | 29 | 30% | 61% | 22% | 14% | 14% | 2% | 0.4976 |
| Idaho | 30 | 41% | 57% | 29% | -24% | 8% | 0.40% | 0.4434 |
| South Carolina | 31 | 31% | 52% | 23% | 30% | 13% | 1% | 0.4757 |
| Arkansas | 32 | 34% | 53% | 25% | 8% | 16% | 0.40% | 0.4799 |
| Illinois | 33 | 34% | 60% | 26% | -0.06% | 11% | 1% | 0.4837 |
| Rhode Island | 34 | 34% | 61% | 21% | 12% | 8% | 1% | 0.464 |
| New York | 35 | 31% | 55% | 25% | -0.50% | 14% | 4% | 0.5208 |
| Alaska | 36 | 37% | 61% | 24% | -1% | 0% | 0.20% | 0.4278 |
| Iowa | 37 | 33% | 63% | 22% | -4% | 8% | 0.40% | 0.4514 |
| New Hampshire | 38 | 28% | 61% | 20% | 4% | 9% | 1% | 0.4466 |
| Michigan | 39 | 31% | 55% | 24% | 2% | 11% | 1% | 0.4685 |
| Pennsylvania | 40 | 29% | 57% | 20% | 9% | 11% | 2% | 0.4778 |
| Ohio | 41 | 30% | 56% | 22% | 5% | 13% | 0.50% | 0.4691 |
| Louisiana | 42 | 34% | 54% | 27% | 7% | 10% | 0.10% | 0.4915 |
| District of Columbia | 43 | 29% | 67% | 18% | 10% | 14% | 0.5111 | |
| Tennessee | 44 | 31% | 54% | 16% | 13% | 1% | 0.4694 | |
| North Dakota | 45 | 30% | 64% | 20% | 5% | 7% | 0.10% | 0.4678 |
| Connecticut | 46 | 27% | 61% | 20% | 7% | 10% | 2% | 0.5008 |
| Kentucky | 47 | 30% | 53% | 23% | 5% | 12% | 0.70% | 0.4845 |
| Mississippi | 48 | 29% | 51% | 25% | 8% | 12% | 0.10% | 0.4806 |
| Alabama | 49 | 29% | 51% | 20% | 10% | 11% | 0.50% | 0.4851 |
| Maine | 50 | 55% | 4% | 4% | 0.4601 | |||
| West Virginia | 51 | 29% | 50% | 24% | -7% | 5% | 0.20% | 0.4804 |
| Average | 34% | 58% | 25% | 8% | 11% | 1.16% | 0.4694 |
Top states
No. 1: Washington
Washington is a great state for women small business owners, considering 42% of its small businesses are owned by women. Of those businesses, 34% make a revenue of $1 million or more. Washington’s employment rate among women (59%) is also high compared to other states. Other studies have also consistently ranked Washington as a great state for women’s overall economic and social well-being.
No. 2: Colorado
Colorado scores high for percentage of employer businesses owned by women (36%), employment rate among women (63%), female-owned businesses that earn a revenue of $1 million or more (27%), and percent change of women-owned businesses from 2012 to 2020 (19%). Each of these high scores makes Colorado a well-rounded state for women small business owners.
No. 3: Delaware
With a high percentage of patents filed by women (13%) and the highest percentage of women’s VC funding per woman-owned businesses (6%), Delaware is a great state for women small business owners to start and run their businesses in.
No. 4: Oregon
Scoring higher than the averages in most of the metrics we measured, Oregon is an excellent state for women small business owners. Some categories it scores exceptionally well in include percentage of employer businesses owned by women (39%), percentage of female owned businesses that earned a revenue of $1 million or more (29%), and percentage of patents filed by women (15%).
No. 5: California
As a powerhouse in share of employer businesses owned by women (38%), percentage of female-owned businesses that earned a revenue of $1 million or more (32%), and percentage of women’s VC funding per woman-owned businesses (4%), California can be a great state for women small business owners.
No. 6: Utah
With a high growth in the number of women small business owners between 2012 and 2020 (22%) and high employment rate among women (60%) Utah is a great place for women small business owners to start and run their small businesses.
No. 7: Maryland
With more and more women becoming small business owners in Maryland (12% increase between 2012 and 2020), the state can be a fantastic option for women looking to start and run their own small businesses. The state also has a high percentage of women filing patents (14%), making it a great place for women inventors.
No. 8: Arizona
Arizona has a high percent increase of women small business owners between 2012-2020 (17%) and a high percentage of female-owned businesses making a revenue of $1 million or more (30%). These high rankings place Arizona eighth on our list, making it an outstanding state for women small business owners.
No. 9: Hawaii
Hawaii is an exceptional state for women small business owners. The Aloha State scores higher than average in share of employer businesses owned by women (38%), percentage change of women owned businesses between 2012 and 2020 (29%), and percentage of female-owned businesses that made a revenue of $1 million or more (25%).
No. 10: Wyoming
Much like Hawaii, Wyoming also scores higher than average in share of employer businesses owned by women (38%) and percentage of female-owned businesses that made a revenue of $1 million or more (31%). Landing at spot number ten, Wyoming is a great state for women small business owners.

Runners-up
The runner-up states tend to more broadly excel in their share of employer businesses owned by women (34% average) and in their employment rates among women (58% average). For example, Montana has a 39% share of employer businesses owned by women and 61% of its women are employed.
Few other runner-up states scored lower percentages in the categories stated above. However, those states make up for lower-than-average percentages in these categories with higher-than-average percentages in other categories. For example, Vermont ranks at 32% in its share of employer businesses owned by women (lower than the average of 34%), but 13% of its patents are filed by women (11% average) and 2% of its women-owned businesses received VC funding (1.16% average).

5 tips for women to start businesses.
Women have valuable experiences and skills they can contribute when building their own businesses. While it can be exciting to run your own business, getting your new gig up and running takes a great deal of effort. These tips will help you get going with your startup:
- Develop a robust business plan – Start with a well-researched business idea, focusing on your unique value in the industry or niche that you’ve chosen. Consider finances, marketing tools, and your operations plan.
- Research loan and grant opportunities for women – The SBA offers programs, grants, and loan aid for women entrepreneurs. One example of aid the SBA provides is through the Office of Women’s Business Ownership, which helps advocate for, educate, and support women entrepreneurs. Various organizations and nonprofits also offer financial support and programs for women entrepreneurs.
- Set up strong legal and financial foundations – Research the differences between LLCs, sole proprietorships, and corporations and choose what type of business structure makes that most sense for your business. Also, separate your personal and professional finances and make sure you are complying with federal and local regulations.
- Network – Connect with other entrepreneurs, women, and mentors who can help in the entrepreneurship journey. Spread the word about your business by joining groups specific to your industry and getting involved with the local business community.
- Practice patience – Starting and running a business takes time and patience. By putting the right tools in place, you'll be able to stay tenacious while establishing your business.
Conclusion
Women’s contributions to the American economy continue to grow and become more pronounced. While women-run businesses are becoming more common, they still come across hurdles that aren’t as common for male-run businesses to face. For example, as of February 26, 2024, women-owned businesses received just 32.6% of the approvals and 28.4% of the dollars offered in SBA 7(a) and 504 loans in the 2023 fiscal year.
This fact, along with our findings emphasize the importance of empowering and acknowledging the importance of women entrepreneurs, encouraging their continual success in business.
Methodology
We used the most recent data for the seven metrics listed below to determine the best states for women entrepreneurs. We used a Z-score distribution to scale each metric relative to the mean across all 50 states and Washington, D.C., and capped outliers at 3. A state’s overall ranking was calculated using its average Z-score across the seven metrics. In cases where states were missing data due to a low sample size, the remaining metrics were averaged to determine their overall scores. Here’s a closer look at the metrics we used:
- Share of employer businesses owned by women including shared ownership, 2021 (Census Bureau)
- Employment rate among women, 2022 (Bureau of Labor Statistics)
- Percentage of female-owned businesses with a revenue of $1 million or more (Census Bureau)
- Percentage change in total women-owned businesses (total number of employer and nonemployer firms) from 2012 (Census Bureau- 2012) to 2020 (Census Bureau- 2020)
- Percentage of patents filed by women (U.S. Patent and Trademark Office)
- Women’s VC funding (deal count) per women-owned businesses (Pitchbook)
- Gini index of overall income inequality (Census Bureau, 2021)
*Information provided on this blog is for educational purposes only, and is not intended to be business, legal, tax, or accounting advice. The views and opinions expressed in this blog are those of the authors and do not necessarily reflect the official policy or position of Lendio. While Lendio strives to keep its content up-to-date, it is only accurate as of the date posted. Offers or trends may expire, or may no longer be relevant.

Black-owned businesses are essential to the US economy, driving innovation, creating jobs, and contributing to the community. However, these businesses often face unique challenges that hinder their success. Discover the state of Black-owned businesses in the US, including key statistics, contributions to the economy, challenges, and access to business financing.
Key facts
- There are an estimated 3.7 million Black-owned businesses in the United States and an estimated 161,422 Black-owned businesses with at least one employee in the United States.
- The District of Columbia has the highest percentage of Black-owned businesses (35%) and employer firms. (15.17%).
- Florida has the largest total number of Black-owned businesses (461,149) and employer firms (18,502).
- World Wide Technology is the largest Black-owned business with $17 billion in annual revenue.
- Black or African American women own an estimated 58,974 businesses with at least one employee, employing 481,930 employees.
- The number of Black-owned businesses increased 13.6% from 2017 to 2020.
- 47% of Black business owners who apply for a loan are denied.
Number of Black-owned businesses in the United States.
The 3.7 million Black-owned businesses in the United States make up 11.3% of all businesses, coming close to the 13% Black population percentage. However, only 2.7% (161,422) of the United States employer firms are Black-owned businesses. Given employer firms are more likely to be profitable and face fewer challenges in acquiring credit, increasing the percentage of Black employer firms is crucial to improving the success of Black entrepreneurs.
States with the most Black-owned businesses.
Large states such as California, New York, and Texas along with Southern states, Florida and Georgia, contain the highest number of Black-owned businesses.
| State | Number of businesses | Number of employer firms |
| Florida | 461,149 | 18,502 |
| California | 252,729 | 15,014 |
| New York | 238,636 | 13,953 |
| Georgia | 380,310 | 14,394 |
| Texas | 404,813 | 12,527 |
States with the highest percentage of Black-owned businesses.
The District of Columbia has the highest percentage of Black-owned businesses along with other Southern states Georgia, Maryland, Mississippi, and Louisiana.
| State | Black Employer Firm Ownership Percentage | Black-owned Businesses Percentage |
| District of Columbia | 15.17% | 35% |
| Georgia | 8.00% | 31% |
| Maryland | 7.88% | 31% |
| Mississippi | 5.68% | 28% |
| Louisiana | 4.62% | 24% |
Top 10 Black-owned businesses
The following section highlights the top Black-owned businesses in the US based on their annual revenue. From World Wide Technology to Hightower Petroleum Co., these companies have made significant contributions to the US economy across various industries such as technology, automotive, food service, and media.
1. World Wide Technology: $17 billion annual revenue
World Wide Technology is a technology solution provider that offers innovative and customized IT solutions to businesses of all sizes. World Wide Technology was founded by David Steward in 1990 and is based in St. Louis Missouri.
2. Act 1 Group: $2.8 billion annual revenue
Act 1 Group is a global consulting and staffing firm that provides professional services in the fields of technology, government, and entertainment. The company was founded in 1998 by Janice Bryant Howroyd, who is often referred to as the first African American woman to build a billion-dollar business. Howroyd started the company with just a single office in California and has since grown it into a multinational corporation with over 17,000 global clients.
3. Bridgewater Interiors: $2 billion annual revenue
Bridgewater Interiors L.L.C. is a Black-owned automotive supplier founded by Ron Hall Sr. and his wife Joyce that provides interior parts and components to major car manufacturers such as General Motors and Ford. The company was established in 1998 and is headquartered in Detroit, Michigan.
4. Coca-Cola Beverages Florida: $1.2 billion annual revenue
Coca-Cola Beverages Florida L.L.C. is a Black-owned Coca-Cola bottler founded by Troy Taylor in 2015 that produces, distributes, and markets Coca-Cola products in Central Florida. The company is headquartered in Tampa, Florida, and has become one of the largest privately held Coca-Cola bottlers in the United States.
5. Modular Assembly Innovations: $1.12 billion annual revenue
Modular Assembly Innovations L.L.C. is a Black-owned company founded by Billy Vickers in 2003 that provides modular assembly solutions to the automotive industry. The company is based in Dublin, Ohio.
6. Bridgeman Foods: $870 million annual revenue
Bridgeman Foods is a holding company founded by Ulysses Bridgeman Jr. in 2016 that operates several restaurant chains, including Chili's Grill & Bar and Fazoli's. The company is based in Louisville, Kentucky, and has become a major player in the restaurant industry.
7. Thompson Hospitality: $800 million annual revenue
Thompson Hospitality Corp. is a food service provider founded by Warren Thompson in 1992 that operates restaurants and other food service facilities across the United States. The company is headquartered in Reston, Virginia.
8. The Anderson-DuBose Co.: $703 million annual revenue
The Anderson-DuBose Co. is a food service distributor founded by Warren Anderson and Wendell DuBose in 1991 that provides products to McDonald's restaurants across the United States. The company is based in Lordstown, Ohio, and has been recognized for its exceptional customer service.
9. Urban One: $484 million annual revenue
Urban One Inc. is a media company founded by Cathy Hughes in 1980 that operates radio stations, digital media outlets, and cable television networks. The company is headquartered in Silver Spring, Maryland.
10. Hightower Petroleum Co.: $450 million annual revenue
Hightower Petroleum Co. is a fuel distributor founded by Milford Hightower in 1984 and is based in Middletown, Ohio. The company is one of the largest minority-owned petroleum distributors in the United States.
Contributions of Black-owned businesses
Black-owned businesses are an integral part of the American economy, contributing significantly to the growth and development of various industries.
- Healthcare and social assistance is the most common sector for Black-owned businesses.
- Black-owned businesses produce about $183.3 billion in annual receipts, employing 1.4 million employees.
- New Mexico has the highest percentage increase (323.8%) in new Black-owned startups from the year 2020-2021.
- Vermont had the highest percentage increase in jobs (93%) at Minority Business Enterprises from 2021 to 2022.
Funding and access to credit
When starting a business, getting funding and access to business loans can be a significant challenge, particularly for entrepreneurs of color.
- 84% of businesses with at least one employee started by a person of color relied on personal savings, friends, or family to fund the business.
- 28% of businesses with at least one employee started by a person of color have obtained a business loan vs 48% of white-owned startups.
- 47% of Black business owners who apply for a loan are denied.
Current challenges
Like other small business owners, Black business owners report growing sales and hiring qualified staff as their most common challenges.
- 63% of Black business owners identified reaching customers/growing sales as an operational challenge.
- 53% of Black business owners identified hiring or retaining qualified staff as an operational challenge.
Black-owned businesses are a vital component of the American economy, driving innovation, creating jobs, and contributing to the community. Despite the challenges they face, such as limited access to funding and credit, Black entrepreneurs continue to make significant strides in various industries. The statistics presented above demonstrate the progress made by Black-owned businesses in recent years but also highlight the need for continued support and resources to ensure their continued success. It is crucial to address the systemic barriers that hinder the growth of Black-owned businesses and provide equal opportunities for all entrepreneurs regardless of their race or ethnicity.
References
2021. U.S. Census. https://data.census.gov/table/ABSCS2021.AB2100CSA01?q=Small%20Business&t=Race%20and%20Ethnicity&y=2021.
U.S. Census. Accessed February 8, 2024. https://data.census.gov/table/ABSCS2021.AB2100CSA01?q=Small%20Business&g=010XX00US$0400000&nkd=ETH_GROUP~001,SEX~001,VET_GROUP~001.
“Business ownership.” 2020. National Equity Atlas. https://nationalequityatlas.org/indicators/Business-ownership.
“Nonemployer Statistics by Demographics series.” n.d. U.S. Census. Accessed February 9, 2024. https://data.census.gov/table/ABSNESD2020.AB2000NESD01.
“Top 100.” n.d. Black Enterprise. Accessed February 8, 2024. https://www.blackenterprise.com/be100s/top100/#top-100.
“2023 Report on Nonemployer Firms: Findings from the 2022 Small Business Credit Survey.” 2023. Fed Small Business. https://www.fedsmallbusiness.org/reports/survey/2023/2023-report-on-nonemployer-firms.
“2023 Report on Startup Firms Owned by People of Color: Findings from the 2022 Small Business Credit Survey.” 2023. Small Business Credit Survey. https://www.fedsmallbusiness.org/reports/survey/2023/2023-report-on-startup-firms-owned-by-people-of-color.
“2022 Minority Businesses Economic Impact Report.” n.d. NMSDC. Accessed February 8, 2024. https://nmsdc.org/wp-content/uploads/2023/08/NMSDC-2022-Minority-Businesses-Economic-Impact-Report-May-2023.pdf.

In general, being an entrepreneur is tough, but many minority entrepreneurs face an even steeper climb on the path to success for a myriad of reasons. They have limited access to startup funding, lack networks and mentorship programs, and face discrimination and systemic biases.
Given these hurdles – and the fact that 20% of all new businesses fail within the first year – it’s critical that minority entrepreneurs set up shop in as favorable a location as possible.
Lendio analyzed eight metrics to determine the best states for minority entrepreneurs, considering factors such as access to small business loans catered to underserved communities, business ownership rates compared to the state’s minority population, job growth at minority-owned businesses, and overall income equality.
Key findings
- Vermont No. 1 Best State for Minority Entrepreneurs: Driven by its high percentage of business loan approvals per 10,000 residents, an influx of minority-owned startups, low unemployment rate, and lower overall income disparities.
- Hawaii has the highest minority business ownership rates in the country. 51% of businesses are owned by minorities in Hawaii while minorities make up 78% of the state’s population. Hawaii dips in overall rankings due to lower access to capital, average unemployment rates, and lower startup growth.
- Washington D.C. has the highest Black business ownership rates in the country. While D.C. also has one of the highest approval rates for Community Advantage loans and microloans, it falls in the overall rankings due to Blacks and African Americans only owning 15% of small businesses despite making up 42% of the population along with high unemployment rates and income disparities.
Top 20 states
In No. 1 Vermont, the number of Community Advantage loans (.015) and SBA microloans (.34 ) approved per 10,000 residents is high (.34). While West Virginia has the least disparity between its minority population and percentage of minority-owned businesses, Vermont comes in third at a 6.7% difference. Vermont also saw a 560% increase in the number of startups under two years old run by minority entrepreneurs from 2000 to 2001 and a 93% increase in job growth at Minority Business Enterprises. With an average unemployment rate of just 2.23% and a Gini index of .45, Vermont provides a fertile economic environment for small business owners.
Wyoming, South Dakota, North Dakota, and New Hampshire round out the top five best places for minority entrepreneurs. Wyoming (161.7) and South Dakota (90.98) both receive a high number of Community Reinvestment Act loans per 10,000 residents. North Dakota saw a large increase (86%) in job growth at Minority Business Enterprises from 2021-2022. New Hampshire has the second lowest minority unemployment rate at 1.5%
When the list is filtered to Black or African American populations specifically, Alaska, New Mexico and Hawaii move into the top 20 with Missouri, Massachusetts, and Ohio dropping out.
| State | Rank (Minorities) | Rank (Black) |
|---|---|---|
| Vermont | 1 | 2 |
| Wyoming | 2 | 1 |
| South Dakota | 3 | 7 |
| North Dakota | 4 | 4 |
| New Hampshire | 5 | 10 |
| Montana | 6 | 5 |
| Maine | 7 | 13 |
| Utah | 8 | 6 |
| Kansas | 9 | 18 |
| Minnesota | 10 | 11 |
| Maryland | 11 | 17 |
| Idaho | 12 | 3 |
| Oregon | 13 | 12 |
| Colorado | 14 | 8 |
| Missouri | 15 | 22 |
| Nebraska | 16 | 14 |
| Florida | 17 | 16 |
| Ohio | 18 | 25 |
| Wisconsin | 19 | 20 |
| Massachusetts | 20 | 27 |
| Alaska | 31 | 9 |
| New Mexico | 47 | 15 |
| Hawaii | 32 | 19 |
States with the highest percentage of minority-owned businesses.
While the rankings above compare the percentage of businesses owned by minorities to the percentage of the population that is a racial minority, these rankings show the percentage of minority-owned businesses overall.
| State | Minority-Owned Businesses |
|---|---|
| Hawaii | 50.87% |
| District of Columbia | 29.45% |
| California | 26.21% |
| Georgia | 22.39% |
| Maryland | 22.18% |
| New York | 21.39% |
| New Jersey | 20.53% |
| Virginia | 19.75% |
| Texas | 18.06% |
| Delaware | 15.69% |
States with the highest percentage of Black-owned businesses.
While the rankings above compare the percentage of businesses owned by Blacks or African Americans to the percentage of the population that is Black or African American, these rankings show the percentage of Black-owned businesses overall. Visit this post for more Black-owned business statistics.
| State | Black-owned businesses |
|---|---|
| District of Columbia | 15.17% |
| Georgia | 8.00% |
| Maryland | 7.88% |
| Mississippi | 5.68% |
| Louisiana | 4.62% |
| Virginia | 4.42% |
| North Carolina | 4.40% |
| Delaware | 4.38% |
| South Carolina | 4.21% |
| Missouri | 4.15% |
Growth of minority-owned businesses
The number of businesses owned by Black, Hispanic, and Asian Americans has climbed to record highs – reaching about 1.2 million in 2020, up more than 50% compared to 2007.
This is welcome news given research shows that workforce diversity is good for the companies’ bottom line and for the economy at large. More than half of the 2 million new businesses started in the U.S. over the past 10 years were launched by minorities, creating 4.7 million jobs. But America has much more work to do to empower minority entrepreneurs. People of color own only 20% of U.S. businesses despite making up roughly 40% of the population. This contributes to income inequality.

Lending environment
Access to capital is crucial for any small business owner, but it is particularly important for minority entrepreneurs who may struggle to secure startup funding or loans from traditional financial institutions. The lending gap – which can also come in the form of unequal lending terms and underinvestment – hinders minority entrepreneurs’ ability to start, invest in and scale their businesses.
The data speaks for itself: 52% of white entrepreneurs are fully approved for financing, compared with 35% of Asians, 28% of Hispanics and 27% of Black applicants. In fact, 40% of Black business owners don’t even apply for financing because they expect they’ll be rejected, according to the National Minority Supplier Development Council.

Minority entrepreneurs may face challenges in obtaining loans or credit from traditional financial institutions, but there are some policies and programs from the Small Business Administration that aim to bridge the funding gap and support entrepreneurship in underrepresented communities.
The Community Reinvestment Act, for example, requires banks to offer lending and investment services to underserved communities, and regulators are considering substantial reform that would make race and ethnicity an explicit focus. Our analysis of CRA loans originated per 10,000 residents – 120 on average across the states – examines how well banks are currently supporting underserved business owners, though it doesn’t address minority business owners specifically. Montana ranked the best on this metric, with 180 in CRA loans per 10,000 residents, while West Virginia came in last with 66.
Meanwhile, the 7(a) Community Advantage loans are targeted at small businesses in underserved markets, including opportunity zones and low- and moderate-income areas. Overall, 49% of these loans went to racial and ethnic minorities in 2023, compared with roughly 33% of 7(a) and 504 loans in 2023, which are other common loans for small business owners.

Economic environment
The overall economic environment in a state also offers clues as to the level of opportunity for minority business owners. Income inequality, for example, is measured using the Gini index; a score of 0 would indicate perfect equality, while a score of 1 indicates total inequality. In the U.S., the Gini index was 0.482 in 2022, up slightly from .481 in 2021.
Studies have found unemployment rates and entrepreneurship rates have a dynamic relationship with unemployment spurring entrepreneurship and entrepreneurship in turn lowering unemployment rates. However, studies have also found that unemployment spurring entrepreneurship only holds true in higher-income areas.
There are also longstanding racial gaps when it comes to underemployment, defined as the share of the labor force that is 1) unemployed, 2) working part-time but would like to work more or 3) recently gave up job-seeking but would prefer to work. According to the Economic Policy Institute, the underemployed rate was 9.8% among Black adults, 9.9% among Hispanics and 5.5% among white people in December 2023.

Conclusion
Not all business owners have equal opportunities to succeed. In particular, minority entrepreneurs face barriers in accessing the capital they need to start and grow their businesses – even in the top-ranked states. With this report, we aim to raise awareness about the need to level the playing field for minority entrepreneurs.
Specifically, we recommend the following within the lending industry:
- Greater use of automation throughout the qualification process: Automation not only expands access to capital for more small businesses by reducing costs for lenders but also reduces discrimination and bias. For example, a paper by the National Bureau of Economic Research found that after traditional banks automated their processes, lending to Black-owned firms increased.
- Alternative underwriting solutions: Many small businesses are cash-only making it difficult to build up the business credit necessary to meet traditional loan qualification requirements. Lendio’s technology mines customer deposit data instead of relying exclusively on credit score to pre-qualify customers for a loan. This approach is supported by a paper from the Bank for International Settlements that found that the alternative data used by two FinTech companies was able to better predict future loan performance than traditional methods, especially in areas with high unemployment.
- We're pleased to see progress toward more resources for underserved groups, like the recent announcement from Treasury Dept and Vice President Harris in April of over $1.73 billion in grants for Community Development Financial Institutions (CDFIs) across the country.
Methodology
We used the most recent data for these eight metrics below to determine the best states for minority entrepreneurs. We used a Z-score distribution to scale each metric relative to the mean across all 50 states and Washington, D.C., and capped outliers at 2. We multiplied some Z-scores by -1, given a higher score was negatively associated with being above the national average. A state’s overall ranking was calculated using its average Z-score across the eight metrics. In cases where states were missing data due to a low sample size, the remaining metrics were averaged to determine their overall scores. Here’s a closer look at the metrics we used:
Lending environment
- Community Advantage Loans approved (Small Business Administration, 2021-2022), per 10,000 residents (Census Bureau, 2022)
- Microloans approved ((Small Business Administration, 2021-2022), per 10,000 residents (Census Bureau, 2022)
- Community Reinvestment Act loans originated for small business owners with revenues of $1 million or less Federal Reserve, 2021, per 10,000 residents (Census Bureau, 2022).
Business environment
- Difference in minority business ownership rate, measured as percentage of employer firms owned by a person of color, (Census Bureau, 2021) vs minority population percentage. (Census Bureau, 2022)
- Percentage change in the number of jobs at designated minority business enterprises (National Minority Supplier Development Council, 2021-2022)
- Percentage change in the number of new businesses (under two years old) that are owned by minorities (Census Bureau, 2020-2021)
Economic environment
- Gini index of overall income inequality (Census Bureau, 2021)
- Minority population average unemployment rate (Economic Policy Institute, Q3 2023)
We ranked states based on the veteran labor market and entrepreneurship.
America’s military members are an industrious group once they enter civilian life. Veterans tend to out-earn their nonveteran peers—and indeed, the median income for veterans reached a record-high of $50,476 in 2022, compared with $38,254 among nonveterans.
Click here to see the top states.
Part of that may be due to their entrepreneurial spirit. There’s no shortage of notable veteran business owners, such as Nike co-founder Phil Knight, FedEx founder Frederick Smith, and Bob Parsons, who founded GoDaddy. Warren Buffett, one of America’s wealthiest people, has even said that the military taught him how to take orders, learn from others, and have fun doing it.

And while the number of veteran-owned businesses has been falling over time, research indicates that veterans are more likely to be self-employed than nonveterans, and that veterans with small businesses have higher average net worths than non-entrepreneurial veterans.
Veterans have unique skill sets and discipline that may prime them perfectly to lead. In surveys, veterans tend to say that their military service helped prepare them to run a small business. But even so, they're more likely than nonveterans to be concerned about business regulations, lack of connections, financing, and getting customers—which could point to a lack of support for veteran entrepreneurs in parts of the country.

Lendio analyzed six metrics to determine the best states for veterans to succeed in business, including veterans’ income, employment, and business ownership, as well as startup survival, patent innovation, and new business growth. Those metrics were split into two subcategories: veteran labor market and entrepreneurship.
The results indicate that the best states for veteran entrepreneurs are scattered across the country, with no one region dominating the list. Support for veterans can be found everywhere—but some states offer softer landing pads for veterans as they decide where to set up shop or expand their businesses.
Some Key Findings:
- Virginia is the No. 1 best state. Driven by strong earnings and employment. Virginia veterans’ median income was $68,124 in 2022, compared with $41,429 among nonveterans.
- Top states span across the U.S. Wyoming, Oregon, West Virginia, and South Dakota rounded out the top five states. They typically had high rates of veteran business ownership (for example, 7.3% in West Virginia) and veteran employment (58.5% in South Dakota).
- States with the strongest veteran labor market aren't always the most entrepreneurial. Some states scored well for one subcategory, but not the other—such as No. 11 Alabama, which ranked second for veteran labor market, but 47th for entrepreneurship. That means states that came out on top in the overall ranking struck a good balance between being good for veteran workers and for those starting a business.
Top states
No. 1: Virginia
Virginia is a great state for veterans in the labor market, given that 58.7% of veterans there are employed and their average earnings are 1.6 times higher than nonveterans—better rates than anywhere else in the U.S.
No. 2: Wyoming
Wyoming scores well for both subcategories (8th for the veteran labor market and 6th for entrepreneurship), helping drive it up to the No. 2 spot overall. The state saw a 42.7% increase in new business applications year over year, the highest rate in the country, plus the median income for veterans is 1.4 times higher than that of nonveterans.
No. 3: Oregon
Oregon lands in the middle of the pack for the veteran labor market, but its strong environment for entrepreneurs helped propel it to the No. 3 ranking. The state reports 96.4 patents per 100,000 population, while 58.4% of startups survive at least five years, the highest rate in the U.S.
No. 4: West Virginia
In West Virginia, 7.3% of businesses are owned by veterans, whose median earnings are 1.4 times as high as those of nonveterans. Further, its startup survival rate is 55%, and it saw 25.9% yearly growth in new businesses.
No. 5: South Dakota
In 2022, 58.5% of South Dakota’s veterans were employed, while 6.1% of businesses are veteran-owned. Meanwhile, 55.7% of startups survive at least five years, the second-highest rate after Oregon.
No. 6: Massachusetts
Massachusetts has a high rate of patents (125.6 per 100,000) and a high startup survival rate (55%), driving it to the best state in the entrepreneurship subcategory. Its veteran workers perform fairly well, with 5.2% of businesses owned by veterans and 46.2% of veterans being employed.
No. 7: Alaska
Alaska’s veterans earn 1.5 times as much as nonveterans, based on median income in 2022. It also has one of the highest employment rates for veterans, at 57.5%.
No. 8: New Hampshire
New Hampshire has one of the highest rates of veteran-owned businesses, at 7.7%, and it saw 80 patents filed per 100,000 population in 2020.
No. 9: New Mexico
Veterans in New Mexico out-earn nonveterans by a ratio of 1.6—the third-highest ratio in the U.S. after Virginia and Alabama. The state also saw 32.8% year-over-year growth in new business applications, behind only Wyoming.
No. 10: Maryland
Maryland was propelled to the top 10 by its high level of veteran employment (54.3%) and strong income ratio, given veterans’ median income is 1.4 times higher than nonveterans’.

Runners-up
The runner-up states tend to excel for either their veteran labor markets or for their entrepreneurship more broadly. For example, 6.8% of businesses in Alabama are owned by veterans, whose median income is 1.6 times higher than nonveterans—a higher rate than almost anywhere else. Texas and South Carolina also scored especially well for their veteran labor markets, driven by their high income ratios (each 1.5).
Meanwhile, states like California, Washington, and Kentucky scored well due to the force of their entrepreneurial communities, with California reporting more patents per 100,000 population than any other state (127.8) and Kentucky seeing 30.5% year-over-year new business growth. Washington also has a high patent rate at 118 per 100,000.

5 tips for veterans to start a business
Veterans have valuable skills and experiences to translate to the private sector. But while it can be highly rewarding to run your own business, getting your firm started is a major endeavor that takes time, planning, and effort. These tips will help you get going:
- Develop a strong business plan - Begin with a well-researched business idea, emphasizing your unique value in the niche or industry you’ve selected. Consider your financial projections, marketing tools, and operations plan.
- Research grants and loan opportunities - The Small Business Administration offers programs, grants, and loans designed to support veteran entrepreneurs, such as the Boots to Business initiative. Some organizations and nonprofits also offer financial support and coaching.
- Network - Connect with other entrepreneurs, veterans, and mentors who can offer guidance and support. Get involved with the local business community and join industry-specific groups to spread the word about your business.
- Establish solid legal and financial structures - Choose wisely whether it makes the most sense to establish an LLC, sole proprietorship, or corporation. Make sure to also separate your personal and professional finances and ensure you’re compliant with federal and local regulations.
- Be patient - It takes time to establish a successful business. With the right tools in place, you'll be able to stay resilient as you get your business up and running.
Conclusion
The success of veterans as entrepreneurs underscores their impressive contributions to the American economy. Our findings emphasize the need for continued efforts to empower veteran entrepreneurs, allowing them to harness their full potential to lead and excel in the business world.
Methodology
We used the most recent federal data for six metrics across two categories to determine the best states for veterans to start a business. We used a Z-score distribution to scale each metric relative to the mean across all 50 states and Washington, D.C., and capped outliers at 3. A state’s overall ranking was calculated using its average Z-score across the six metrics, while its subcategory ranking was calculated using its average Z-score across the three relevant metrics. Three states were missing data for veteran business ownership (Virginia, Wyoming, and Oregon) so their scores were calculated across the remaining five metrics. Here’s a closer look at the metrics we used:
- Veteran labor market
- Share of employer businesses owned by veterans, 2020 (Census Bureau)
- Median income ratio, veterans to nonveterans, 2022 (Census Bureau)
- Employment rate among veterans, 2022 (Bureau of Labor Statistics)
- Entrepreneurship
- Five-year startup survival rate, March 2022 (Bureau of Labor Statistics)
- Patents per 100,000 population, 2020 (U.S. Patent and Trademark Office)
- Growth in new business applications, Aug. 2022-2023 (Census Bureau)
No results found. Please edit your query and try again.